Measure what matters: cold email metrics without the guesswork.
Every cold email campaign produces numbers, and most senders read the wrong ones. They celebrate a 50% open rate, ignore a 0.4% reply rate, and wonder why the pipeline is empty. This guide on cold email metrics fixes that order. It sets out the metrics that matter, from delivered to revenue, shows how to calculate each one with real worked examples, and explains how to read a campaign report like a diagnosis, not a scoreboard.
You will learn which numbers are vanity and which ones pay, what good looks like against Instantly’s 2026 benchmark, and how each sending tool reports the same campaign differently. The tone is reassuring on purpose: the numbers are not there to judge you. They are there to tell you exactly what to fix next.
Check Instantly →See Smartlead →Visit Lemlist →All worked examples in this guide are our own arithmetic from a stated example campaign, labelled as such. The only external benchmark cited is Instantly’s 2026 benchmark, attributed plainly in the text. Features and pricing can change, so please check the provider’s site before you buy. We do not guess at features, prices or trials.
Quick Answer
The cold email metrics that matter are delivered, bounce, reply, positive reply, meetings booked, opportunities and revenue. Track reply rate against delivered emails, positive reply rate against delivered emails too, and meetings booked as a share of positive replies. Ignore open rate as a success metric, because Apple Mail Privacy Protection inflates it, and ignore total sends and list size entirely.
A healthy campaign sits near Instantly’s 2026 benchmark: about 3.4% reply rate, 1 to 3% positive replies, bounce under 2%, and spam complaints under 0.1%. When a number is off, it points at one fix: low opens mean a deliverability problem, low replies mean a targeting or copy problem, and low meetings mean an offer or call-to-action problem. Fix the metric that is broken, not the one that looks worst.
Contents
- What cold email metrics actually measure
- Cold email metrics that matter
- The cold email funnel, from sent to revenue
- Vanity metrics to ignore
- Cold email metrics benchmarks for 2026
- How to calculate each cold email metric
- How to read a campaign report
- Diagnosing problems from the numbers
- How each tool reports cold email metrics
- Reading A/B test results honestly
- The honest pros and cons of tracking cold email metrics
- Pick the right cold email metrics setup for you
- Frequently asked questions
- The verdict
Numbers are a map, not a verdict
Firstly, a cold email metric is a simple thing: a count of what happened, divided by a count of what could have happened. In fact, that is the whole idea, and it is also the reason so many reports mislead. For example, a reply rate of 8% sounds strong until you learn it was counted against opens, not against delivered emails, and the real rate was 1.7%. Similarly, an open rate of 55% sounds like success until you learn that Apple Mail Privacy Protection opened half the emails automatically. Moreover, the fix is not more data. It is a clear definition for each number, used the same way every week. In short, this guide gives you those definitions first, and the benchmarks second.
Secondly, the good news is that you only need eight numbers. In fact, most dashboards show thirty, and twenty-two of them are decoration. For instance, the eight that matter follow the journey of one email, from the moment it leaves your mailbox to the moment it becomes revenue, and each one answers a single question. Thirdly, once you know the eight, every report becomes readable in two minutes, and every fix becomes obvious. As a result, this guide spends its time on the eight, and it names the rest as vanity so you can stop watching them.
What cold email metrics actually measure
In fact, cold email metrics measure a funnel, not a single event. For example, an email is sent, it is delivered or it bounces, it is opened or ignored, it earns a reply or it does not, and the reply turns into a meeting, an opportunity, or nothing at all. Similarly, each step has its own metric, and each metric has its own denominator, which is the part most people get wrong. Moreover, a rate is only honest when the denominator is stated, so this guide states it every time. In short, read the funnel from top to bottom, and the story of your campaign appears.
Secondly, the funnel also explains why one weak step can hide behind a strong one. In fact, a campaign with a 60% open rate and a 0.5% reply rate has a copy problem, not a deliverability problem, because the emails are landing and nobody cares. For instance, a campaign with a 2% reply rate and zero meetings has an offer problem, because people reply and then walk away. Thirdly, the funnel keeps the diagnosis honest: fix the step that is actually broken, and the steps below it improve on their own. As a result, the first skill in this guide is not calculation. It is reading the funnel in order.
The three questions every report must answer
- Did the emails land? Delivery, bounce and spam rates answer this. If the emails never reach the inbox, nothing else matters.
- Did the right people care? Reply rate and positive reply rate answer this. A reply is interest, and a positive reply is buying intent.
- Did it make money? Meetings, opportunities, closed deals and revenue answer this. Everything above exists to serve this question.
Thirdly, keep those three questions in mind as you read the rest of this guide. In fact, every metric below belongs to one of them, and every benchmark is judged against one of them. For example, open rate belongs to the first question, but only as a smoke alarm, not as a success metric, because Apple Mail Privacy Protection broke it as a measure of attention. Moreover, the tables below mark each metric with its question, so you can see at a glance which part of the funnel it guards. In sum, three questions, eight metrics, and one funnel: that is the whole system.
Cold email metrics that matter
In fact, eight metrics carry the whole story of a campaign, and the table below defines each one. For example, the first four guard delivery and engagement, and the last four guard the pipeline, which is where the money is. Similarly, the formula column shows the exact division, and the good column shows what to aim for, with the benchmark source named where it comes from. Moreover, two of the good figures come from Instantly’s 2026 benchmark, and the rest are our own worked targets from the example campaign later in this guide, labelled as such. In short, learn these eight, and you can read any report.
Cold email metrics: delivery and engagement
| Metric | What it counts | Formula | What good looks like |
|---|---|---|---|
| Delivered | Emails accepted by the recipient server | Sent minus bounced | 98% or more of sent |
| Bounce rate | Emails rejected by the recipient server | Bounced / sent x 100 | Under 2% (Instantly 2026 benchmark) |
| Open rate | Unique opens, as tracked by a pixel | Unique opens / delivered x 100 | About 21% (Instantly 2026), but unreliable |
| Reply rate | Unique human replies | Replies / delivered x 100 | About 3.4% (Instantly 2026 benchmark) |
| Positive reply rate | Replies showing genuine interest | Positive replies / delivered x 100 | 1 to 3% (Instantly 2026 benchmark) |
The table above covers the five delivery and engagement metrics. Reply rate and positive reply rate are counted against delivered emails, not against opens, because that is the honest denominator. Last checked: 16 November 2026.
Cold email metrics: pipeline and revenue
| Metric | What it counts | Formula | What good looks like |
|---|---|---|---|
| Meetings booked | Calls booked from positive replies | Meetings / positive replies x 100 | About 25% of positive replies* |
| Opportunities | Meetings that become real sales chances | Opportunities / meetings x 100 | About a third of meetings* |
| Revenue | Money closed from the campaign | Deals won x average deal value | Above the campaign cost* |
| Cost per meeting | What each booked call cost you | Campaign cost / meetings booked | Below your value per meeting* |
The table above covers the four pipeline and revenue metrics. Figures marked * are our own worked targets from the example campaign in this guide, not an external benchmark. Last checked: 16 November 2026.
Secondly, notice what the two tables have in common: every rate names its denominator. In fact, that is the habit that separates an honest report from a flattering one. For example, Smartlead counts reply rate against unique opens, not against delivered emails, which makes its number look higher than the same campaign measured the Instantly way. Similarly, some tools count every reply, including out-of-office messages, while others count only human replies. Moreover, the lesson is simple: before you compare two numbers, check that they were counted the same way. In sum, the definition matters more than the digit.
The cold email funnel, from sent to revenue
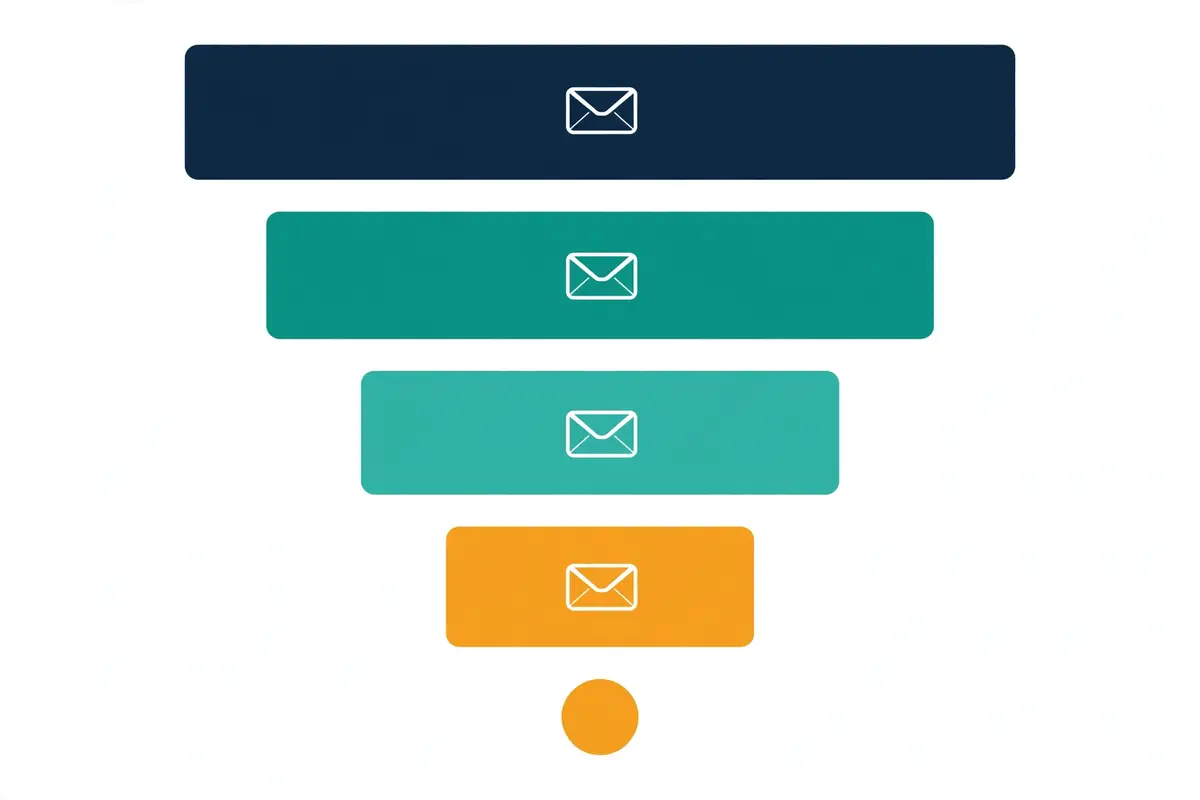
In fact, the funnel is steep, and that is normal, not a sign of failure. For example, our worked example later in this guide sends 5,000 emails and ends with 2 closed deals, which is a 0.04% conversion from sent to won. Similarly, that sounds tiny until you remember the arithmetic: 5,000 emails cost a few hundred dollars, and 2 deals at $4,800 each return $9,600. Moreover, the funnel is the reason cold email works at scale: each step loses most of the volume, and the survivors are worth far more than the senders. In short, judge the funnel by the value at the bottom, not by the width at the top.
Secondly, the funnel also tells you where to spend your time. In fact, a 10% improvement at the top, such as a better subject line, adds a few opens, while a 10% improvement at the bottom, such as a better call to action, adds meetings and revenue. For instance, our subject lines guide covers the top of the funnel, and our replies guide covers the bottom, where a fast, helpful answer turns a positive reply into a booked call. Thirdly, the table below shows the worked example funnel in full, so you can see each step shrink. As a result, keep it beside your own report, and compare step by step.
Cold email metrics: the worked example funnel
| Stage | Count | Rate | What it tells you |
|---|---|---|---|
| Sent | 5,000 | 100% | The size of the campaign |
| Delivered | 4,910 | 98.2% of sent | List quality and warm-up are healthy |
| Opened | 1,031 | 21.0% of delivered | Subject lines are working, roughly |
| Replied | 167 | 3.4% of delivered | Targeting and copy are on benchmark |
| Positive replies | 98 | 2.0% of delivered | The offer resonates with the right people |
| Meetings booked | 24 | 24.5% of positive replies | The call to action converts |
| Opportunities | 9 | 37.5% of meetings | Calls qualify into real chances |
| Closed won | 2 | 22.2% of opportunities | The pipeline pays for the campaign |
The table above is our own arithmetic from a stated example campaign of 5,000 sent emails, not measured data from a real campaign. The rates match Instantly’s 2026 benchmark where noted, and the rest follows from the example counts. Last checked: 16 November 2026.
Thirdly, read the funnel from the bottom up when you set targets. In fact, most senders start at the top, with a sends target, and that is backwards. For example, if you need 10 meetings a month, and a quarter of positive replies become meetings, you need 40 positive replies, and at a 2% positive reply rate you need 2,000 delivered emails. Similarly, that chain is the planning method in our scaling guide, and it turns a vague goal into a concrete sends target. Moreover, the chain also shows why list quality beats list size: a smaller, cleaner list lifts every rate below it. In sum, start from the meetings you need, and work upwards.
Vanity metrics to ignore
In fact, vanity metrics are numbers that feel good and change nothing. For example, a 60% open rate looks like a win, but it cannot tell you whether anyone will buy, and since Apple Mail Privacy Protection it cannot even tell you whether anyone opened the email. Similarly, a list of 100,000 contacts sounds impressive, but a list that bounces at 8% will damage your domains faster than it fills your pipeline. Moreover, the test for a vanity metric is simple: if the number doubled tomorrow, would your revenue change? In short, if the answer is no, stop watching it.
Cold email metrics: the vanity list
- Open rate, on its own: Apple Mail Privacy Protection opens emails automatically, so the number is inflated and cannot be trusted as a measure of attention. Use it only as a smoke alarm for deliverability.
- Total sends: sending more emails is not a result. A campaign that sends 50,000 emails and books no meetings has failed, however big the send count looks.
- List size: a big list is a liability until it is verified. What matters is how many of those contacts are real, reachable, and in your target market.
- Click rate, on its own: clicks show curiosity, not intent, and most cold emails should not need a link at all. A click without a reply is a reader who left.
- Total replies, without sentiment: a reply count that mixes out-of-office messages, unsubscribes and genuine interest is a padded number. Split replies into positive, neutral and negative before you judge them.
- Emails per day: speed is a deliverability risk, not a badge. Sending 40 emails per mailbox per day is the ceiling Instantly’s benchmark warns about, not a target to beat.
Secondly, vanity metrics are not useless in every context. In fact, open rate still has one honest job: it tells you when something breaks. For instance, if your open rate falls from 21% to 4% in a week, your emails are landing in spam, and that is a signal worth acting on. Thirdly, the same logic applies to clicks: a sudden fall in clicks can mean a broken link or a tracking problem. As a result, treat vanity metrics as alarms, not as goals, and keep the goals on replies, meetings and revenue.
Why dashboards push vanity numbers
Thirdly, watch out for the dashboard trap. In fact, most sending tools put open rate at the top of the report in large type, because it is the biggest number, and the biggest number looks like the most important one. For example, a report that leads with a 52% open rate and hides a 0.3% positive reply rate is flattering you, and flattery does not book meetings. Moreover, the fix is a habit, not a setting: read the report from the bottom up, starting with meetings and revenue, and only then check the rates above. In sum, the number at the bottom is the one that pays.
Cold email metrics benchmarks for 2026
In fact, a benchmark is only useful when you know where it came from, so this section names its source plainly. For example, every figure below comes from Instantly’s 2026 Cold Email Benchmark Report, which analysed billions of emails, and the report puts the average reply rate at about 3.4%. Similarly, the same report puts positive replies at 1 to 3%, and it shows 58% of replies arriving from the first email, with 42% coming from follow-ups. Moreover, opens sit at about 21% in the same report, but the report itself warns that opens are unreliable under Apple Mail Privacy Protection. In short, these are the only external benchmarks this guide cites, because they are the only ones we verified.
Cold email metrics: the Instantly 2026 benchmark
| Metric | Instantly 2026 benchmark | What it means for you |
|---|---|---|
| Reply rate | About 3.4% average | Below 2% means targeting or copy needs work |
| Positive reply rate | 1 to 3% of delivered | Below 1% means the offer is not landing |
| First email share | 58% of replies | Follow-ups earn the other 42%, so keep sending them |
| Open rate | About 21% | Useful only as a deliverability alarm |
| Bounce rate | Under 2% | Above 2% means the list needs cleaning |
| Spam complaints | Aim under 0.1%, never 0.3% | Above 0.3% risks inbox placement badly |
| Sends per mailbox | 25 to 30 a day, max 40 | More than 40 a day risks deliverability |
The table above cites Instantly’s 2026 Cold Email Benchmark Report, as reported on instantly.ai. The interpretation column is our own guidance, not part of the benchmark. Last checked: 16 November 2026.
Secondly, treat the benchmark as a range, not a pass mark. In fact, a reply rate of 2% is not a failure if your list is hard to reach and your deal value is high, and a reply rate of 6% is not a success if none of the replies are positive. For instance, the benchmark is most useful as a tripwire: a number far below it tells you where to look, and a number far above it tells you to check the counting before you celebrate. Thirdly, remember that benchmarks move with the market, so re-check them each year. As a result, use this table to diagnose, not to judge, and compare your campaign against its own past first.
Watch the reply-rate walkthrough
Video: How this cold email wiz gets 19.5% replies in Instantly AI by Lead Gen Jay on YouTube. This video is the creator’s property, embedded via YouTube for education. OutreachCompare is not affiliated with Lead Gen Jay and does not claim ownership of this video.
In addition, the video above shows what a strong reply rate looks like in practice. Above all, it is an interview with a cold emailer who reports a 19.5% reply rate inside Instantly, and it walks through the targeting and copy choices behind that number. For example, the discussion covers list quality, personalisation, and follow-up timing, which are the same levers this guide covers. Moreover, the figure is the interviewee’s own claim, not a benchmark, and it is far above the 3.4% average, so treat it as an example of what is possible, not as a target. As a result, watch it for the method, not for the number.
Thirdly, a word of caution about big numbers in videos and case studies. In fact, a 19.5% reply rate usually comes from a small, warm, tightly targeted list, and the same approach on a cold list of 5,000 would almost certainly land lower. For instance, that is not a criticism of the video, it is a fact about how lists work. As a result, compare your campaign with the 3.4% benchmark first, and treat exceptional claims as inspiration, not as a promise.
How to calculate each cold email metric
In fact, every metric in this guide is one division, and the worked examples below use the same example campaign throughout, so the numbers stay consistent. For example, the campaign sent 5,000 emails, 90 bounced, 4,910 were delivered, 1,031 were opened, 167 people replied, 98 of those replies were positive, 24 meetings were booked, 9 became opportunities, and 2 closed, at an average deal value of $4,800. Similarly, the campaign cost $500 in our stated assumption, covering the sending tool, domains, list and verification. Moreover, every calculation below is our own arithmetic from those stated counts, labelled as such, so you can follow each step and reuse the method on your own numbers. In short, copy the formula, not the result.
Delivery rates: bounce and delivered
Start with delivery, because nothing else counts until the email lands. Firstly, the bounce rate is bounced divided by sent, times 100. In fact, 90 bounced out of 5,000 sent gives 90 / 5,000 x 100, which is 1.8%, and that sits under the 2% benchmark, so the list is healthy. Secondly, delivered is simply sent minus bounced, which is 5,000 minus 90, giving 4,910. Thirdly, delivered is the denominator for every rate that follows, so get it right first. As a result, a bounce rate above 2% means the list needs cleaning before anything else, and our deliverability guide covers the fix in full.
Engagement rates: opens, replies and positive replies
Next come the engagement rates, and the denominator is delivered, not sent. Firstly, the open rate is unique opens divided by delivered, times 100. In fact, 1,031 opens out of 4,910 delivered gives 21.0%, which matches the Instantly benchmark, but remember that Apple Mail Privacy Protection inflates this number, so treat it as a rough signal. Secondly, the reply rate is replies divided by delivered, times 100. For instance, 167 replies out of 4,910 delivered gives 3.4%, exactly on the benchmark average. Thirdly, the positive reply rate is positive replies divided by delivered, times 100. As a result, 98 positive replies out of 4,910 delivered gives 2.0%, inside the 1 to 3% benchmark range.
Secondly, also calculate the positive share of replies, because it tells you whether the replies are real interest or mostly noise. In fact, the formula is positive replies divided by all replies, times 100. For example, 98 positive replies out of 167 total replies gives 58.7%, which means nearly six in ten replies were genuine interest. Moreover, a campaign with a 5% reply rate and a 10% positive share is weaker than a campaign with a 3% reply rate and a 60% positive share, because the second one produces more real conversations. In sum, the positive share is the quality check on the reply rate.
Pipeline rates: meetings, opportunities and revenue
Finally, follow the money, because the pipeline rates are the ones that justify the campaign. Firstly, the meeting rate is meetings divided by positive replies, times 100. In fact, 24 meetings out of 98 positive replies gives 24.5%, which means about one in four interested people booked a call. Secondly, the opportunity rate is opportunities divided by meetings, times 100. For instance, 9 opportunities out of 24 meetings gives 37.5%. Thirdly, the close rate is deals won divided by opportunities, times 100, which is 2 out of 9, giving 22.2%. As a result, revenue is 2 deals times the $4,800 average deal value, which is $9,600, and the return on the $500 assumed cost is ($9,600 minus $500) divided by $500, which is 1,820%.
Secondly, cost per meeting is the number to quote in a budget meeting. In fact, the formula is campaign cost divided by meetings booked. For example, $500 divided by 24 meetings gives $20.83 per meeting, and $500 divided by 98 positive replies gives $5.10 per positive reply. Moreover, those two figures let you compare cold email with any other channel on equal terms: if a paid ad costs $120 per meeting, cold email at $20.83 is the cheaper channel, even before you count the pipeline it builds. In sum, cost per meeting turns a report into a business case.
How to read a campaign report
In fact, reading a report is a habit, not a talent, and the habit has four steps. For example, start at the bottom, with meetings and revenue, then check the reply and positive reply rates, then check delivery, and only then look at opens. Similarly, that order stops the biggest number from misleading you, because a 55% open rate cannot rescue a campaign with zero meetings. Moreover, the worked report below is the same example campaign from the calculation section, laid out the way a tool would show it. In short, read it in the order below, and the diagnosis writes itself.
Cold email metrics: the worked example report
| Metric | Result | Benchmark | Reading |
|---|---|---|---|
| Sent | 5,000 | n/a | Campaign size |
| Bounced | 90 (1.8%) | Under 2% | Healthy, list is clean |
| Delivered | 4,910 | 98% or more | Good, 98.2% |
| Opened | 1,031 (21.0%) | About 21% | On benchmark, treat with care |
| Replied | 167 (3.4%) | About 3.4% | On benchmark average |
| Positive replies | 98 (2.0%) | 1 to 3% | Inside the range |
| Meetings booked | 24 | n/a | 24.5% of positive replies |
| Spam complaints | 3 (0.06%) | Under 0.1% | Healthy, under the aim |
The table above is our own arithmetic from a stated example campaign, not measured data from a real campaign. Benchmarks are from Instantly’s 2026 benchmark. Last checked: 16 November 2026.
Secondly, the reading of this report is simple: the campaign is healthy. In fact, every metric sits on or inside its benchmark, the bounce rate is under 2%, the spam rate is under 0.1%, and the reply and positive reply rates match the averages. For instance, the one number to watch is the meeting rate, because 24 meetings from 98 positive replies is good but not great, and a faster reply to positive responses could lift it. Thirdly, the next step for this campaign is not a new subject line, because opens and replies are already fine. As a result, the fix is at the bottom of the funnel: answer positive replies faster, and make the booking step easier.
Watch the dashboard walkthrough
Video: How i book 732+ Meetings a Month by Tracking 1 Dashboard by Sabo Nagy on YouTube. This video is the creator’s property, embedded via YouTube for education. OutreachCompare is not affiliated with Sabo Nagy and does not claim ownership of this video.
In addition, the video above shows a real dashboard in use. Above all, it walks through the exact dashboard the creator uses to track cold email reply rates, burnt domains and KPIs, and how to set it up for free. For example, the video covers the same habit this section teaches: read the dashboard for decisions, not for decoration, and watch the numbers that predict meetings. Moreover, the video is the creator’s own work, embedded here for education. As a result, watch it with your own report open, and compare the layout with the one above.
Thirdly, notice how the video treats the dashboard as a working tool, not a trophy. In fact, the creator checks it to decide what to fix next, which is exactly the habit this guide teaches. For instance, a dashboard that nobody acts on is just a screensaver, and the weekly review is what turns numbers into improvements. As a result, set a fixed weekly time to read your report in the order above, and write down one fix each week.
Diagnosing problems from the numbers

In fact, every broken campaign shows the same handful of symptoms, and each symptom points at one fix. For example, low opens with low replies means the emails are not landing, while good opens with low replies means the emails land and nobody cares. Similarly, good replies with no meetings means the offer or the booking step is the problem, not the email. Moreover, the table below matches each symptom to its cause and its first fix, so you can diagnose a campaign in five minutes. In short, find your symptom, then fix only that thing.
Cold email metrics: symptom, cause and first fix
| Symptom | Most likely cause | First fix |
|---|---|---|
| Low opens, low replies | Deliverability or subject lines | Check inbox placement, warm-up and authentication |
| Good opens, low replies | Targeting or copy | Tighten the list, rewrite the first line and the offer |
| Good replies, low meetings | Offer or call to action | Make booking one click, answer positives fast |
| High bounce, over 2% | List quality | Verify the list, remove stale and risky addresses |
| High spam, over 0.1% | Infrastructure or content | Slow the send rate, check links and wording |
| High unsubscribes | Wrong audience or too frequent | Narrow the targeting, space the follow-ups out |
| Low positive share | Offer mismatch | Check the offer against the list, not the email |
The table above is our own diagnostic guidance. Benchmarks in it come from Instantly’s 2026 benchmark. Last checked: 16 November 2026.
Secondly, the most common mistake is fixing the wrong step. In fact, a sender with a 1% reply rate often rewrites the subject line, when the real problem is a list full of the wrong job titles. For instance, a subject line can only earn the open, and the open is already happening, so the fix belongs in the body, the targeting, or the offer. Thirdly, the same logic applies in reverse: a sender with a 5% open rate who rewrites the copy is wasting time, because the emails are landing in spam and nobody reads them. As a result, always diagnose before you edit, and edit only the step the numbers blame.
When the first email does all the work
Thirdly, one symptom deserves a special note: replies clustered in the first step only. In fact, Instantly’s benchmark shows 58% of replies arriving from the first email, which means 42% arrive from follow-ups, so a campaign with no follow-up replies has a follow-up problem. For example, the cause is usually a follow-up that adds nothing new, such as a bare bump with no value, or a sequence that stops after two emails. Moreover, our sequencing guide sets out a full cadence, and our templates guide gives the follow-up wording. In sum, if the first email does all the work, the sequence is too short.
A weekly routine that keeps the numbers honest
- Monday: read the report bottom-up, meetings first, opens last, and write down the one weakest step.
- Tuesday: make one change to that step only, such as a new first line, a cleaner list segment, or a faster reply routine.
- Friday: compare the new week with the old week, and keep the change only if the broken metric moved.
- Monthly: check the benchmark table again, and reset any target that no longer matches your list or your deal value.
Fourthly, the routine matters more than any single fix. In fact, a campaign improves by small weekly steps, not by one big rewrite, because each step is tested against the numbers before the next one starts. For instance, changing the subject line, the list and the offer in the same week tells you nothing, because you cannot tell which change worked. As a result, one change a week, measured honestly, beats a monthly overhaul every time.
How each tool reports cold email metrics
In fact, every sending tool reports the same campaign differently, and the differences matter more than the similarities. For example, Smartlead counts reply rate against unique opens, while Instantly’s own guide counts it against delivered emails, so the same campaign can show two different reply rates in two tools. Similarly, some tools split replies by sentiment automatically, while others leave the sorting to you. Moreover, the tables below only claim what was verified on the providers’ own sites or their official help centres on 16 November 2026, and where a feature was not confirmed, they say so plainly. In short, use the tables to shortlist, then check the counting method before you compare tools.
Cold email metrics: Instantly, Smartlead and Lemlist
| Tool | What its reports show | A/B test readouts | Export | From |
|---|---|---|---|---|
| Instantly | Campaign analytics, opportunity tracking, Unibox master inbox, inbox placement tests | A/B testing with variant comparison | Check the site | $47/mo |
| Smartlead | Campaign Dashboard: Sent, Opened, Replied, Positive Reply, Bounced, Sender Bounced; Master Inbox sentiment | A/Z testing of variants | CSV export and API | $39/mo |
| Lemlist | Campaign reports with open, reply and bounce rates; lemwarm deliverability reports | A/B testing | Check the site | $69/mo |
The table above only claims what was verified on the providers’ own sites or their official help centres. Smartlead’s dashboard columns and reply-rate formula are documented in its help centre, and Instantly’s reply-rate formula in its own guide. Prices are list prices checked 16 November 2026: Instantly Growth $47/mo, Smartlead Base $39/mo, Lemlist Email $69/mo. Features and pricing can change, so please check the provider’s site before you buy. We do not guess at features, prices or trials.
Cold email metrics: Reply.io, Apollo, Klenty and Woodpecker
| Tool | What its reports show | A/B test readouts | Export | From |
|---|---|---|---|---|
| Reply.io | Sequence analytics, reply and meeting tracking, Jason AI reporting | A/B testing of template versions | Check the site | From $59/mo |
| Apollo | Sequence reporting with open and reply rates, deal tracking | A/B testing | Check the site | Free, then $49/mo |
| Klenty | Cadence analytics, reply and meeting tracking | A/B testing | Check the site | $50/mo |
| Woodpecker | Campaign statistics, open, reply and bounce tracking, bounce shield reports | A/B testing | Check the site | $35/mo |
The table above only claims what was verified on the providers’ own sites or their official help centres. Prices are list prices checked 16 November 2026: Reply.io Email Volume from $59/mo, Apollo Basic $49/mo (a free plan exists), Klenty Starter $50/mo annual, Woodpecker entry $35/mo monthly ($23.33/mo annual). Reply.io’s annual figures, Jason monthly price and Agency price were visible on 15 November but not in the page fetched on 16 November, so please confirm them on the site. Features and pricing can change, so please check the provider’s site before you buy. We do not guess at features, prices or trials.
Secondly, the counting difference is the detail to remember. In fact, Smartlead’s own help centre states its reply rate as replies divided by unique opens, falling back to unique sent when open tracking is off, while Instantly’s guide defines reply rate as unique human replies divided by delivered emails. For instance, the same campaign could show 4.2% in Smartlead and 3.4% in Instantly, and both numbers would be honest under their own definitions. Thirdly, the practical rule is simple: compare campaigns inside one tool, never across tools, unless you have checked the denominators first. As a result, pick a tool, learn its counting, and stay consistent.
What to check before you trust a dashboard
- The reply-rate denominator: delivered, sent, or opens? The answer changes the number by a full point or more.
- Whether replies are split by sentiment: a tool that labels positive replies automatically saves hours of manual sorting in the inbox.
- Whether out-of-office replies are filtered: an unfiltered count inflates the reply rate with messages that are not from humans.
- Whether meetings and revenue are tracked: a tool that stops at replies cannot tell you the cost per meeting, which is the number that matters most.
- Whether reports export cleanly: if you cannot export the numbers, you cannot build the weekly routine in this guide.
Thirdly, a note on the Smartlead warmup correction, because it affects the reporting story. In fact, Smartlead’s premium Warmup Pool is a $59 a month add-on on the Base and Pro plans, and it is free only from the Unlimited Smart plan upwards. For example, an earlier version of our coverage said warmup was included on every plan, and that was wrong, so this guide states the correct position. Moreover, the correction matters for metrics, because warmup protects the deliverability numbers that every other metric depends on. In sum, check the plan before you assume the feature.
Reading A/B test results honestly
In fact, A/B testing is where most metric mistakes happen, because a small sample can lie with confidence. For example, a test with 200 emails per variant and a 3% baseline can only detect a jump to about 9.8%, so a real improvement from 3% to 4.5% would look like noise. Similarly, that is why so many tests end with the words no clear winner, and the sender changes nothing. Moreover, the fix is sample size, not optimism, and the numbers below come from our A/B testing guide, re-derived at 80% power and 95% confidence. In short, run the test long enough, or do not run it at all.
Cold email metrics: sample sizes for A/B tests
| Baseline reply rate | Improvement you want to detect | Emails needed per variant |
|---|---|---|
| 1% | To 2% | About 2,300 |
| 2% | To 3% | About 3,800 |
| 3% | To 4.5% | About 2,500 |
| 5% | To 10% | About 430 |
The table above is our own arithmetic, re-derived at 80% power and 95% confidence, matching our A/B testing guide. Small lists need longer tests, because small differences need large samples to prove. Last checked: 16 November 2026.
Secondly, the worked example shows how easily a test misleads. In fact, imagine variant A gets 31 replies from 1,000 delivered emails, which is 3.1%, and variant B gets 42 replies from 1,000 delivered, which is 4.2%. For instance, B looks like a clear winner, up 1.1 points, but at 1,000 per variant the difference is not conclusive, because the table above says a 3% to 4.5% lift needs about 2,500 per variant. Thirdly, the honest move is to keep the test running to 2,500 per variant, or to accept the result as a hint, not a verdict. As a result, never stop a test early because one variant looks ahead.
Thirdly, test one thing at a time, and test the metric that matters. In fact, a subject-line test should be judged on replies, not on opens, because an open without a reply is a reader who left. For example, a clickbait subject line can lift opens by 10 points while cutting replies in half, and a test judged on opens would crown the wrong winner. Moreover, the same rule applies to the whole campaign: judge every test on positive replies and meetings, and let opens stay in their job as a deliverability alarm. In sum, the test is only as honest as the metric that judges it.
The honest pros and cons of tracking cold email metrics
In fact, tracking metrics has real costs, and this guide would not be honest if it pretended otherwise. For example, a dashboard can become a distraction, and a sender who checks the numbers ten times a day is not improving the campaign, just watching it. Similarly, a metric can become a target, and once a target, it can be gamed: a team judged on reply rate will count out-of-office replies, and a team judged on opens will write clickbait subject lines. Moreover, the costs are real, and they are the reason some senders track too little, not too much. In short, the honest case for metrics is not that they are free, but that a campaign without them is guesswork.
Cold email metrics: the pros
- Diagnosis: the numbers tell you exactly which step is broken, so you fix one thing instead of rewriting everything.
- Comparison: two campaigns measured the same way can be compared fairly, and the winner can be kept with confidence.
- Budget proof: cost per meeting turns cold email into a number a finance team can compare with any other channel.
- Early warning: a falling open rate or a rising bounce rate warns you days before the pipeline dries up.
- Learning: a weekly routine builds a record of what worked, so each campaign starts smarter than the last.
Cold email metrics: the cons
- Distraction: checking the dashboard ten times a day feels like work, and it is not work. Read it once a week, then act.
- Gaming: a metric that becomes a target will be gamed, so judge on positive replies and meetings, which are hard to fake.
- False precision: a reply rate of 3.41% is not meaningfully different from 3.38%, and treating it as a win is self-deception.
- Denominator traps: tools count differently, so a number compared across tools can mislead by a full point or more.
- Over-testing: small samples produce noise, and acting on noise is worse than acting on nothing.
Pick the right cold email metrics setup for you
In fact, the right setup depends on two things: how much you send, and who reads the report. For example, a solo founder sending 2,000 emails a month needs a simple dashboard and a weekly routine, while an agency sending 200,000 emails across ten clients needs per-client reporting, sentiment splitting, and an API export. Similarly, the table below matches the situation to the tool, and the prices are the list prices checked on 16 November 2026. Moreover, the decision is worth testing before you commit: run one campaign in the shortlisted tool, read its report in the order this guide teaches, and keep the tool whose numbers you trust. In short, pick the tool that counts the way you want to count.
Cold email metrics: pick this tool when
| Pick this tool when | Tool | Why it fits |
|---|---|---|
| You want opportunities and revenue tracked | Instantly | Opportunity tracking, Unibox, from $47/mo |
| You want positive replies split automatically | Smartlead | Master Inbox sentiment, from $39/mo |
| You want reports plus A/B testing in one place | Lemlist | Reports and A/B testing, from $69/mo |
| You want AI help reading the replies | Reply.io | Jason AI reporting, from $59/mo |
| You want data and sending in one tool | Apollo | 240M+ contacts with sequences, free plan |
| You run a sales team with a CRM habit | Klenty | Cadence analytics, from $50/mo |
| You want simple stats and a low entry price | Woodpecker | Clear campaign statistics, from $35/mo |
The table above is our decision framework for this guide. Prices are list prices checked 16 November 2026. Reply.io’s annual figures, Jason monthly price and Agency price were visible on 15 November but not in the page fetched on 16 November, so please confirm them on the site. Last checked: 16 November 2026.
Secondly, the decision is also about the counting method, not just the price. In fact, a tool that counts reply rate against opens will always look better than one that counts against delivered, and the cheaper-looking number is not the better tool. For instance, ask each shortlisted tool for its definitions before you buy, and compare the definitions, not the digits. Thirdly, remember the free plan where one exists: Apollo offers a free plan with 75 credits per seat per month, which is enough to test its reporting on a small campaign. As a result, the decision framework above is a starting point, and your own report is the final judge.
Frequently asked questions
What is the most important cold email metric?
Positive reply rate, counted against delivered emails. Firstly, it is the closest number to buying intent, because a positive reply means someone read the email, understood the offer, and wants to talk. Secondly, reply rate on its own is weaker, because it mixes genuine interest with out-of-office messages and polite noes. In sum, watch positive reply rate first, meetings booked second, and everything else after those two.
What is a good reply rate for cold email in 2026?
About 3.4% on average, according to Instantly’s 2026 benchmark, with positive replies at 1 to 3%. Firstly, that is the average across billions of emails, so a well-targeted campaign can beat it, and a broad list can sit below it. Secondly, the benchmark is most useful as a tripwire: a reply rate under 2% means the targeting or the copy needs work. In sum, aim for the average first, then beat it with better lists and better first lines.
Should I still track open rates?
Yes, but only as a deliverability alarm, not as a success metric. Firstly, Apple Mail Privacy Protection opens emails automatically, so the open rate is inflated and cannot tell you whether anyone actually read your email. Secondly, a sudden fall in open rate still means something: it usually means your emails are landing in spam. In sum, keep the open rate on the dashboard, read it last, and never judge a campaign by it.
How do I calculate reply rate?
Divide unique human replies by delivered emails, then multiply by 100. Firstly, delivered means sent minus bounced, and the replies counted should be from humans, not out-of-office messages. Secondly, check your tool’s definition before you trust its number, because Smartlead counts reply rate against unique opens, which gives a higher figure for the same campaign. In sum, use the delivered denominator, and state it whenever you quote the rate.
How many emails do I need before I trust the numbers?
More than most senders think. Firstly, a 3% to 4.5% lift in reply rate needs about 2,500 emails per variant at 80% power and 95% confidence, according to the sample sizes in our A/B testing guide. Secondly, a test with 200 emails per variant can only detect a jump to about 9.8%, so small tests mostly produce noise. In sum, run the test to the sample size, or treat the result as a hint, not a verdict.
Which tool is best for cold email metrics?
It depends on what you want the numbers to do. Firstly, Instantly fits senders who want opportunities and revenue tracked, from $47 a month. Secondly, Smartlead fits senders who want positive replies split automatically, from $39 a month. Thirdly, Lemlist fits senders who want reports and A/B testing together, from $69 a month. In sum, pick the tool whose counting method you trust, test it on one campaign, and keep it if the report reads clearly.
The verdict
Our verdict on cold email metrics
Best metric: positive reply rate. Counted against delivered emails, it is the closest number to buying intent. Best habit: read the report bottom-up. Meetings and revenue first, replies second, delivery third, opens last. Best benchmark: Instantly 2026. About 3.4% reply rate, 1 to 3% positive replies, bounce under 2%, spam under 0.1%. Best tool for tracking: Instantly. Opportunity tracking and Unibox, from $47 a month. Best for positive replies: Smartlead. Master Inbox sentiment, from $39 a month.
We have not tested these tools hands-on, so the tool rows in this guide are based on the vendors’ documented features and list prices checked on 16 November 2026, not on a trial. The worked examples are our own arithmetic from a stated example campaign, and the only external benchmark cited is Instantly’s 2026 benchmark, attributed plainly. The honest advice is simple: track eight numbers, read them bottom-up, fix one step a week, and let the meetings tell you whether the campaign works.
Keep reading
- A/B Testing for Cold Email 2026, the sample sizes and method behind every test in this guide.
- Cold Email Sequencing Guide 2026, the cadence that earns the 42% of replies that come from follow-ups.
- How to Handle Cold Email Replies 2026, what to do when the metrics earn you a reply.
- Inbox Placement Guide 2026, the fix when your opens fall and your emails land in spam.
- Deliverability Guide 2026, the full fix for bounce, spam and authentication problems.
- Cold Email Warmup Schedule 2026, the warm-up routine that protects your delivery numbers.
- How to Write Cold Emails That Get Replies 2026, the copy that lifts the reply rate in the first place.
- Cold Email Subject Lines 2026, the subject lines that earn the open honestly.
- How to Scale Cold Email 2026, the scaling ladder, with the mailbox math behind it.
- Cold Email Templates 2026, 22 templates to test against your metrics.